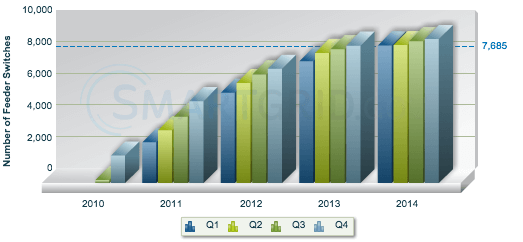
Installation of advanced switches, sensors, and communication equipment is expected to improve reliability (e.g., shorten the duration of outages), enhance system efficiencies, and reduce operations and maintenance costs. This chart shows the number of automated feeder switches installed as part of the Smart Grid Investment Grant (SGIG) program, and conveys the approximate extent of coverage in the United States resulting from SGIG funding.
SGIG Automated Feeder Switches Installed and Operational
Deployed as of March 31, 2015
** Number of entities reported: 54
Updated on March 13, 2015
The table below includes SGIG program distribution system expenditures.
SGIG Program Electric Distribution Asset Expenditures
Deployed as of December 31, 2014
Updated March 11, 2015
|
Electric Distribution Automation Assets |
Quantity* |
Incurred Cost** |
Number of Entities Reporting*** |
|
Automated feeder switches |
9,061 |
$450,777,312 |
49 |
|
Automated capacitors |
11,007 |
$121,911,889 |
43 |
|
Automated regulators |
10,665 |
$18,480,004 |
33 |
|
Fault current limiter |
0 |
$217,260 |
4 |
|
Feeder monitors |
4,447 |
$101,533,161 |
27 |
|
Substation monitor |
20,263 |
$118,513,082 |
16 |
|
Distribution automation/Substation communication networks |
|
$526,743,581 |
60 |
|
Distribution management systems |
|
$331,142,712 |
40 |
|
IT hardware, systems, and applications that enable distribution functionalities |
|
$137,002,266 |
32 |
|
Other electric distribution automation related costs |
|
$296,590,009 |
90 |
|
Total electric distribution automation cost |
|
$2,102,911,277 |
90 |
|
Electric Distribution Distributed Energy Resource (DER) Assets |
Quantity* |
Incurred Cost** |
Number of Entities Reporting*** |
|
Stationary electricity and energy storage devices |
196 |
$3,285,403 |
2 |
|
EV charging stations |
492 |
$5,536,573 |
9 |
|
DER interconnection and communication equipment |
0 |
$0 |
0 |
|
Other DER related costs |
|
$6,661,234 |
40 |
|
Total DER cost |
|
$15,483,210 |
40 |
* In some circumstances, costs were incurred before devices were installed resulting in a reported cost where the quantity is zero.
Projects only reported data on devices they planned to install. Each project installed equipment that best supported their individual goals. Therefore, the number of projects reporting is expected to vary by equipment category. The individual project reporting pages show what equipment that project installed.
** All dollar figures are the total cost, which is the sum of the federal investment and cost share of the recipient (the recipient cost share must be at least 50% of the total overall project cost).
*** In some cases the number of entities reporting was greater than the total number of projects funded by the Recovery Act because some projects had multiple sub-projects that reported data. View list of sub-projects.
Projects
The location, information, and data for each smart grid project are provided in this section.Click for Projects
Publications
These reports include analysis, impacts, lessons learned, best practices, analytical tools, and case studies that were supported by the Recovery Act Smart Grid Programs.Click for Publications
